
Introduction
Picture this. You are in the middle of an incident and you think you have the logs you need. Then you start digging for that one event to confirm lateral movement or privilege escalation. It is either not there at all, or it is buried under so much noise that it takes hours to find.
This is the reality for many SOC analysts and detection engineers. Telemetry should give you visibility. Instead it often creates blind spots, spiralling storage costs, and endless frustration. You either do not have enough data, or you are drowning in the wrong kind.
Getting your data house in order is not about collecting everything. It is about collecting the right things in the right way so that your detections actually work. In this blog you will learn how to build a telemetry strategy that balances cost with coverage, ensures quality over quantity, and leaves you with data that is reliable when you need it most.
The Telemetry Problem
Detection engineering lives or dies on data. If the right events are not collected, no detection rule in the world will fire. If too much irrelevant data is collected, analysts end up buried in noise. The challenge is not just about getting logs into a SIEM or data lake. It is about making sure those logs are useful, reliable, and aligned with what you want to detect.
Three common pitfalls show up again and again:
- Collecting too little. Teams often skip vital sources because of storage costs or misconfigured logging policies. A classic example is Windows Event Logs. Many organisations do not enable detailed process creation logging (Event ID 4688). Without it, detections for suspicious child processes such as
powershell.exespawning fromwinword.exewill never trigger. You cannot detect what you never logged. - Collecting too much. On the flip side, some teams enable every log possible in cloud environments. This quickly generates millions of events per day, many of which have no security value. For instance, API logs from AWS or Azure can overwhelm a SIEM if retention policies are not tuned. Analysts are left wading through oceans of noise, while detection rules slow down or fail completely.
- Collecting the wrong things. Even when the volume looks healthy, the content may not match detection needs. Take Active Directory as an example. You might collect basic authentication success logs, but if you do not capture failed attempts, lockouts, or privilege escalation events, you miss the very signals attackers generate when trying to brute force accounts or escalate rights.
The result is the same. You think you are covered, but when the pressure is on, you cannot see the signals you need. Without a deliberate telemetry strategy, detection engineering becomes guesswork.

Foundations of a Telemetry Strategy
The key to effective detection engineering is not logging everything. It is logging with intent. A telemetry strategy should start with clear detection goals, then map those goals to the specific data you need. Think of it as working backwards: begin with the threats you care about, then decide what logs are essential to see them.
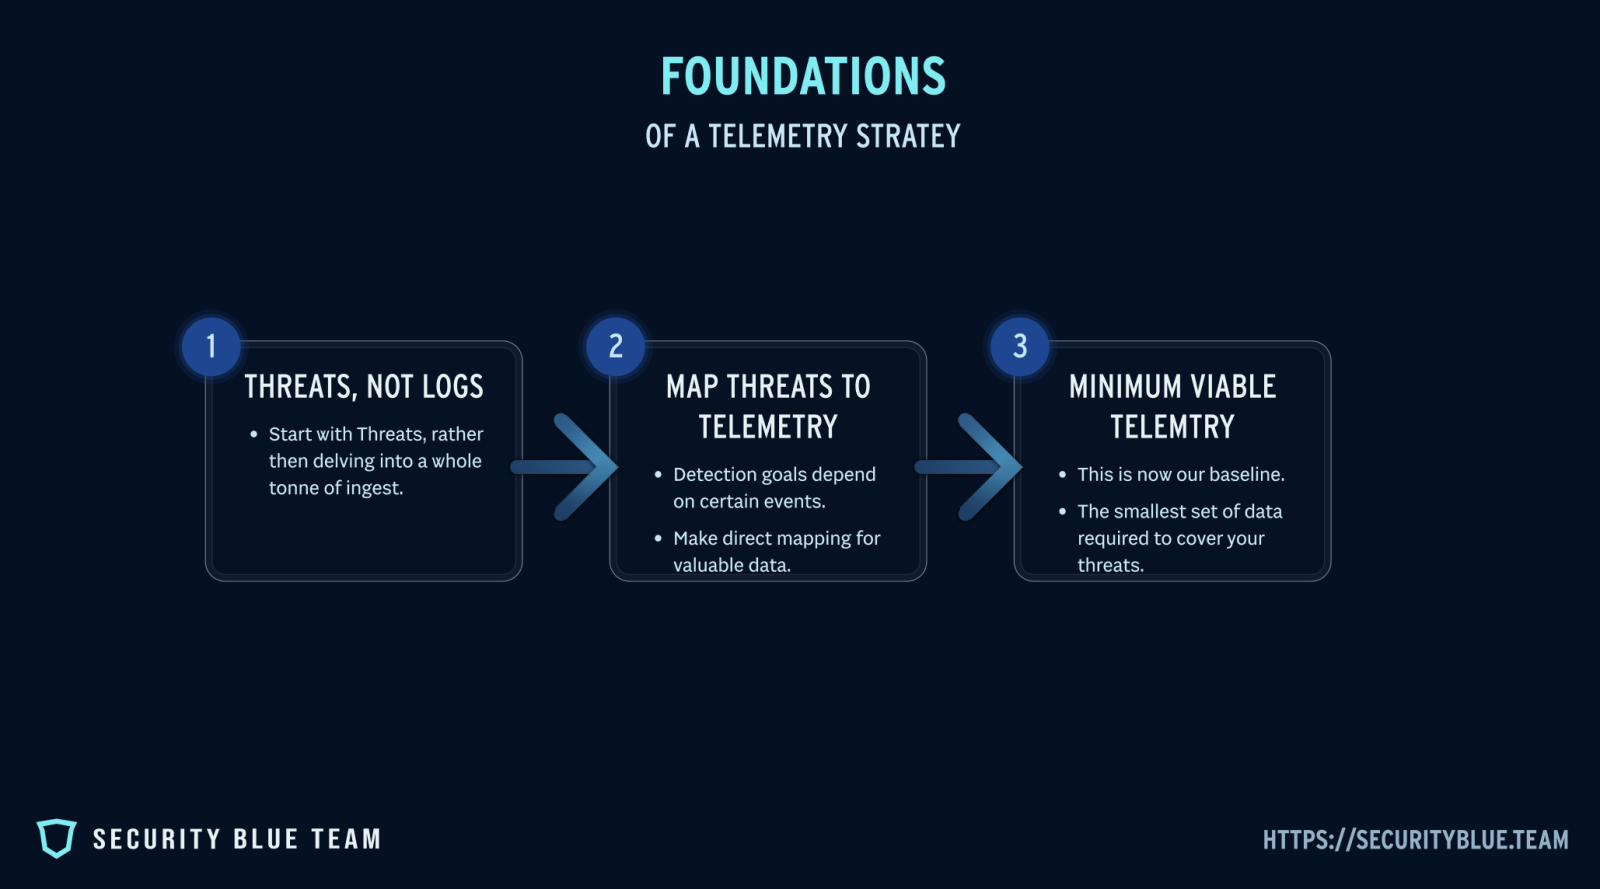
Start with threats, not logs.
Instead of asking “what should we collect,” ask “what are we trying to detect.” Use frameworks like MITRE ATT&CK or your own threat models to list high-priority behaviours. For example, if lateral movement is a concern, you will need authentication logs, process creation data, and endpoint telemetry.
Map threats to telemetry requirements.
Each detection goal depends on certain events. Credential dumping requires process execution events and EDR telemetry. Privilege escalation requires security event logs from Active Directory. By making a direct mapping, you avoid wasting resources on logs that do not serve a detection purpose.
Prioritise critical log sources.
Not every log source is equal. Some provide far greater detection value than others. For most environments, high-value sources include:
- Windows Event Logs (especially 4624, 4625, 4688, 4768, 4769)
- Active Directory logs (authentication, group changes, privilege escalations)
- Endpoint Detection and Response (EDR) Data
- Cloud audit logs (AWS CloudTrail, Azure Activity Logs, GCP Audit Logs)
- Firewall and network logs (for lateral movement and exfiltration detection)
Build a “minimum viable telemetry set.”
This is your baseline: the smallest set of logs you need to cover the top threats in your environment. Once this is in place, you can expand with additional sources, but your core visibility is already secure.
Practical Example Mapping
Let’s say your detection goal is to identify Kerberoasting attacks (MITRE ATT&CK T1558.003).
- Threat behaviour: Attackers request service tickets for accounts with weak passwords, then attempt to crack them offline.
- Required telemetry:
- Windows Security Event ID 4769 (Kerberos service ticket requests).
- Active Directory logs showing unusual service ticket requests, especially targeting high-value accounts.
- Correlation with authentication success/failure events (4624, 4625).
- Detection use case: A spike in 4769 events from a single host, or requests targeting accounts rarely used, can trigger a detection rule for potential Kerberoasting.
Without event 4769 in your telemetry strategy, this attack is invisible. With it, you gain a reliable signal that can be paired with detection logic.
By starting with threats and mapping them to required telemetry, you shift from guesswork to strategy. Instead of drowning in data, you build a focused collection that supports detection rules directly.
Balancing Cost vs Coverage
Even with the best intentions, no organisation can afford to collect and store every log from every system forever. Telemetry has a price. Storage, licensing, and ingestion fees all add up quickly, and unmanaged growth can leave your SIEM bill higher than your security budget. A good telemetry strategy needs to strike a balance between visibility and cost.

Tier your logging strategy.
Not every log source deserves the same treatment. Build three tiers to manage priorities:
- Tier 1: Critical must-have logs. These directly enable high-value detections, such as Windows security events, Active Directory logs, and EDR telemetry. They should always be collected and retained.
- Tier 2: Useful but situational logs. Examples include DNS queries, proxy logs, and application logs. These add value in investigations but may not drive core detections. You might collect them at shorter retention or only from sensitive segments.
- Tier 3: Nice-to-have or redundant logs. These may support niche use cases but rarely provide unique detection value. They can often be dropped, sampled, or stored outside the SIEM in cheaper cold storage for occasional investigations.
Adjust retention with purpose.
Critical logs should be retained for at least the duration of your threat model (often 90 days or more), since many intrusions unfold slowly. Less critical logs can be rotated out sooner or stored in lower-cost storage like object buckets with delayed access.
Understand diminishing returns.
At some point, more data does not equal better detections. Ingesting every single API event or verbose debug log rarely helps. Instead, you should focus on the handful of signals that align with detection goals.
Use enrichment instead of duplication.
Rather than collecting five different sources that provide overlapping information, enrich your highest value logs with context. For example, adding asset or user context to authentication logs is often more effective than collecting every possible log source.
Ensuring Data Quality
Having the right log sources is only half the battle. If the data is incomplete, inconsistent, or misaligned, your detections will fail or produce endless false positives. Poor data quality is one of the silent killers of detection engineering.
Completeness.
Logs need to be collected end to end without gaps. A single misconfigured agent or disabled audit policy can leave blind spots that attackers exploit. For example, if one domain controller is not forwarding security events, you lose visibility of half the authentication activity in your network.
Consistency.
Data should arrive in a standardised format. If one set of logs uses UTC timestamps and another uses local time, correlating events across sources becomes painful. Normalising data into consistent fields for time, host, and user identity prevents confusion and speeds up investigations.
Accuracy.
Event logs often include system names, user IDs, and IP addresses. If DNS resolution is broken or usernames are truncated, your detections can misfire. Enriching logs with reliable context such as asset inventories or HR data for user roles ensures detections operate on clean, accurate signals.
Timeliness.
Logs are only useful if they arrive when you need them. Delays in forwarding or ingestion can turn a real-time detection into a post-mortem. Streamlining collection pipelines and monitoring ingestion health is essential for responsive detection.
Detecting the Gaps
It is easy to assume your telemetry strategy is solid until an incident proves otherwise. The best way to avoid surprises is to test coverage regularly. By actively searching for gaps, you can fix them before attackers find them.
Telemetry audits.
Run regular reviews of your log collection pipeline. Are all endpoints forwarding events? Are all domain controllers configured to produce the right security logs? Are cloud accounts feeding audit logs into your central system? Simple health checks catch silent failures before they become blind spots.
Red and purple team exercises.
Simulated attacks are one of the best ways to test telemetry. A red team attempt at credential dumping or persistence can show whether the relevant logs exist and whether they are usable. Purple teaming takes it further by mapping each attacker technique against your detections and verifying whether the data source is actually present.
MITRE ATT&CK coverage mapping.
Mapping your detection logic against ATT&CK techniques helps highlight where telemetry is missing. For example, if you have detections for lateral movement but no logging of remote service creation (Event ID 7045), you have identified a clear gap.
Instrumentation checks.
Sometimes the logs exist, but the right level of detail does not. For example, if PowerShell logging is enabled at a minimal level, you may capture script launches but miss the actual command content. Testing instrumentation levels is just as important as confirming log sources are present.
Building Feedback Loops
A telemetry strategy is not something you set once and forget. Environments change, new threats emerge, and detections evolve. Without feedback loops, your carefully designed log collection can drift out of alignment within months.
Learn from incidents.
Every incident, whether a true positive or a false alarm, is a chance to review your telemetry. Did you have the data you needed to investigate? Were some signals missing? Capture those lessons in a central log strategy document so that fixes are applied permanently, not just in the heat of the moment.
SOC feedback to engineering.
Analysts are often the first to notice gaps or noise in the data. If authentication logs are inconsistent or if a particular log source never helps in investigations, that insight should feed back into detection engineering. Encourage analysts to document frustrations and successes so the data strategy can adapt.
Continuous validation.
Threats evolve, and so do your detections. A rule written last year might require new telemetry today. Routine validation, such as quarterly ATT&CK mapping or purple team testing, ensures your data still matches your detection goals.
Close the loop with automation.
Where possible, monitor the health of log ingestion pipelines automatically. Dashboards or alerts that highlight missing log sources, delayed events, or dropped data keep your telemetry reliable without waiting for someone to stumble across a blind spot.
Case Study: When Telemetry Falls Short
During a ransomware incident at a mid-sized organisation, the SOC quickly realised something was wrong. Endpoints were encrypting files, and servers were going offline. The team rushed to investigate, but when they checked their SIEM, the logs they needed were missing.
- No detailed process creation logs were available from workstations.
- Only half of the domain controllers were forwarding security events.
- Cloud audit logs had been turned off months earlier to save money.
The result was chaos. Analysts could see the symptoms but not the root cause. They could not tell how the attackers had gained access or how they were moving through the network. Containment took days longer than it should have.
After the dust settled, the company redesigned its telemetry strategy. They defined a minimum viable set of critical logs, ensured consistent forwarding from all domain controllers, and set clear retention tiers. Within months, a follow-up red team exercise confirmed that lateral movement and credential theft attempts were now visible and detectable.
This case highlights the difference between “collecting logs” and having a deliberate telemetry strategy. Without the right data, detections cannot function. With the right data, the SOC gains speed, clarity, and confidence.
Action Plan: Getting your Data House in Order
You do not need to boil the ocean to fix your telemetry. Start small, focus on what matters most, and build from there. Here is a simple step-by-step framework to design a telemetry strategy that supports effective detections:
Step 1: Define your detection goals.
List the top threats and behaviours you want to detect in your environment. Use MITRE ATT&CK or recent incident reports as a guide.
Step 2: Map threats to required telemetry.
For each threat, identify which events are essential. For example, Kerberoasting requires event 4769, while credential dumping needs process creation logs and EDR telemetry.
Step 3: Build your minimum viable telemetry set.
Create a baseline list of critical log sources. Prioritise Windows Event Logs, Active Directory logs, EDR data, and cloud audit logs.
Step 4: Tier your data.
Decide which logs are critical, which are useful but situational, and which can be offloaded to cheaper storage or dropped. Apply retention policies that reflect their value.
Step 5: Audit and validate.
Check that all intended sources are actually being collected. Run purple team or ATT&CK coverage reviews to highlight missing signals.
Step 6: Monitor data quality.
Ensure logs are complete, consistent, accurate, and timely. Fix gaps in forwarding, synchronise timestamps, and enrich data with context.
Step 7: Build feedback loops.
Review telemetry after every incident, feed analyst insights into your strategy, and use automation to monitor pipeline health.
Conclusion
Telemetry is the foundation of detection engineering, yet it is often the weakest link. Collect too little and you miss the signals that matter. Collect too much and you drown in noise while burning through your budget. The answer is not to log everything, but to log with intent.
By defining your detection goals, mapping them to the telemetry you need, and applying a tiered approach to cost and retention, you can build a data strategy that works in practice. Add regular audits, purple team exercises, and feedback loops, and your telemetry will stay aligned with both your environment and the evolving threat landscape.
Detection engineering is only as good as the data underneath it. Get your data house in order, and every detection you build will be stronger, faster, and more reliable when it matters most.
If you want to take your detection engineering skills further, the Certified Junior Detection Engineer (CJDE) from Security Blue Team is a great next step. It focuses on practical skills like rule creation and data analysis, giving you hands-on experience to turn telemetry strategy into action.
